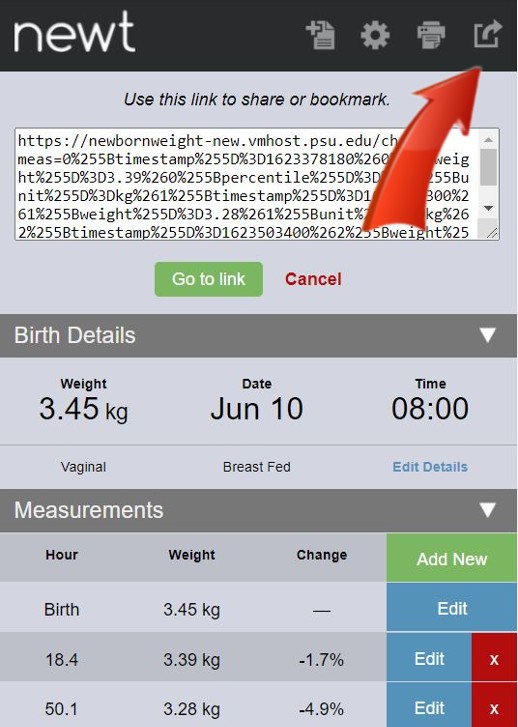
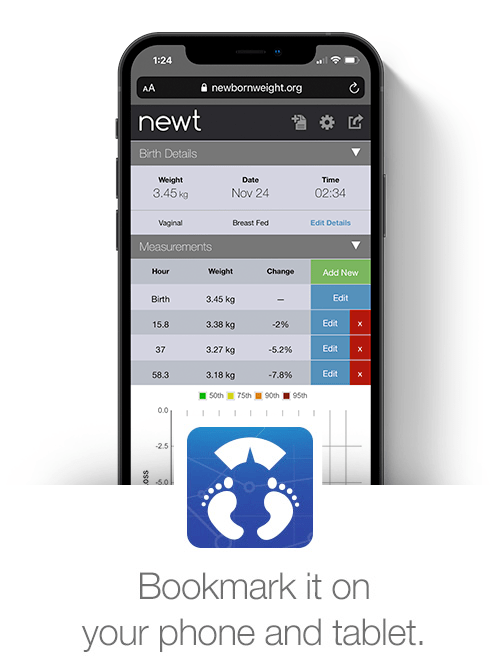
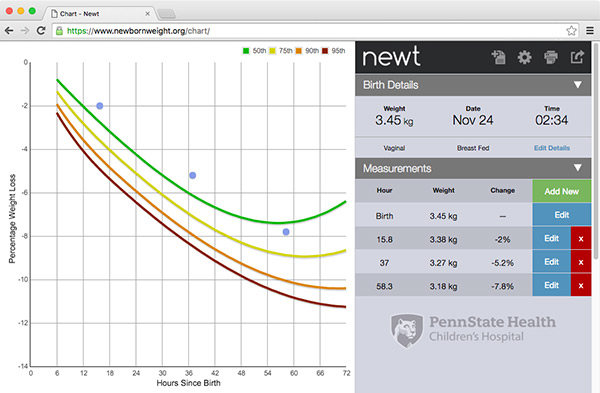
Help
Please see the help topics below if you’re having trouble using Newt. To learn more about the data behind Newt, including why we created this tool, visit the about page. If you cannot find an answer to your question, please send us a message.
Getting started
Newt requires two measurements to get started. Measurements include weight (in grams/kilograms or pounds/ounces), and date and time (in 24-hour format – 00:00). Newt also requires that users define delivery method – weight loss percentiles are different for vaginal and cesarean newborns.
This information is entered on the Newt homepage.
Date and time formatting
Time must always use 24-hour formatting, where 00:00 represents midnight (12:00 am) and the greatest possible value is 23:59 (11:59 pm). Invalid times will not be accepted and will result in an error message.
Adding measurements to your graph
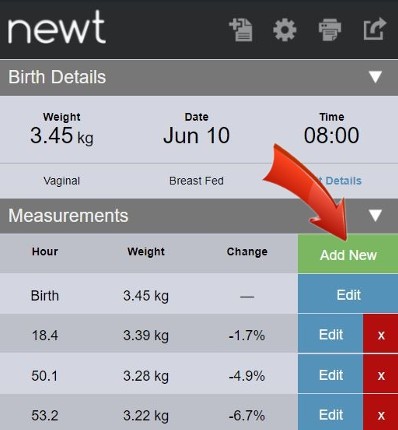
After plotting your first measurement in newt you’ll be able to plot additional measurements. To add a measurement, click the green “Add New” button that appears in the “Measurements” section of the application. If you do not see this button click/tap the gray “Measurements” bar to see if it’s hidden from display.
Enter weight and a valid date/time combination in the form that appears and press “Add this measurement.”
Deleting measurements
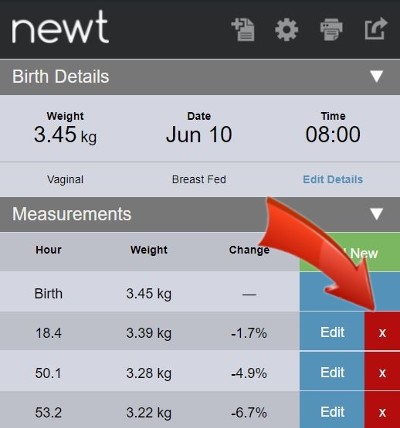
Simply click the red “x” box for the measurement you’d like to delete. You’ll be prompted to confirm this decision, as you cannot undo this action once it’s complete. If you do not see a red “x” box or your measurements listed to the side of the graph, click/tap the measurements header to ensure it’s not hidden from display.
Adjusting screen options
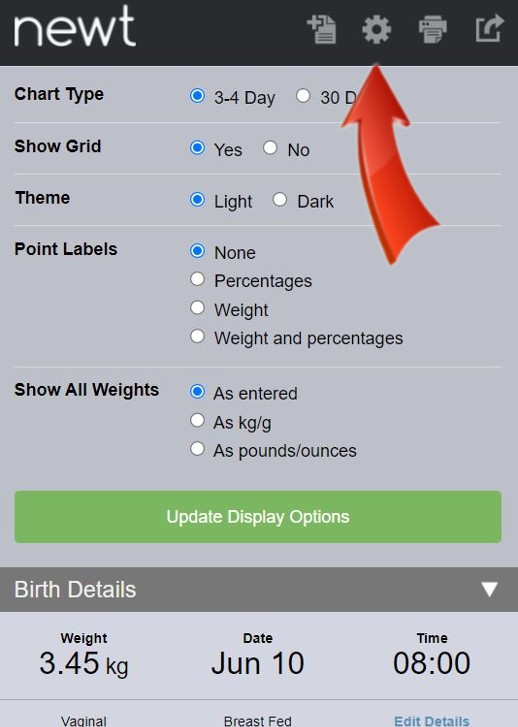
Click the gear icon in the upper right to adjust various screen options. These options include:
Display as pounds – Displays all g/kg values as pounds. This does not convert the values to pounds, however. You must still enter/edit the values as g/kg.
Show grid – Set to “no” to hide the grid lines on the graph. Axis lines will still remain visible.
Theme – Set to “dark” to change the graph background to blue instead of white.
Point labels – By default, there are no labels below the points on the graph. Use this option to display weight values, percentage weight loss values or a combination of weight and percentage.
Zooming in and out of the graph
You can zoom in and out of the graph using the scroll wheel on your mouse, or by using your laptop’s trackpad if it recognizes “multitouch” gestures (such as using two fingers to scroll). Alternatively, double clicking on the graph will zoom in. After you’ve zoomed in or out, you may reposition the graph by clicking and dragging the graph contents.
Note: The graph does not zoom on touch screen devices.
Save/share a graph
Print a graph
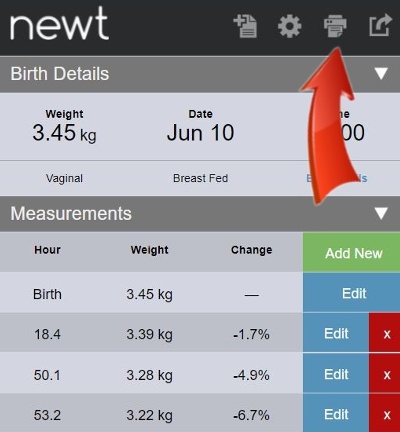 Click the “printer” icon in the top toolbar to print the graph and measurement details. The information will be reformatted for print on a standard 8.5 x 11 sheet of paper.
Start over (create a new graph)
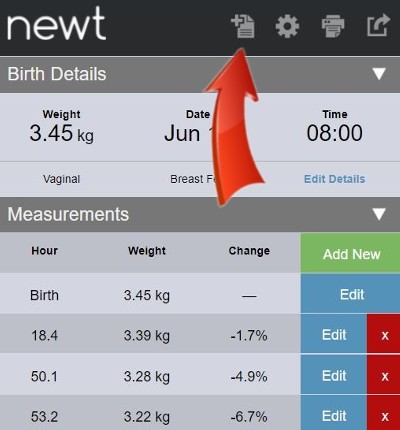
To start over, press the “create new” icon in the upper right. Starting over will clear your data, so be sure to save a link to your graph if you’d like to come back to it later.
Edit birth details
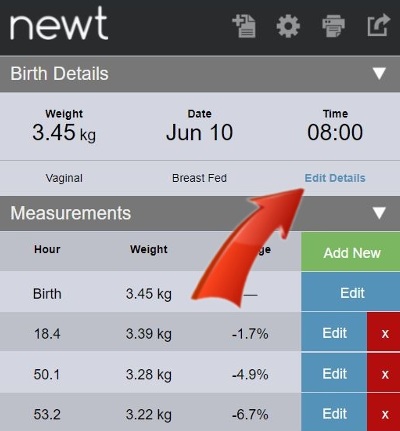 You may edit birth details (weight, date, time, delivery method) at any time. Click the “edit details” link below the birth details display to open the birth details form. Make any necessary adjustments and press “update birth details.”


